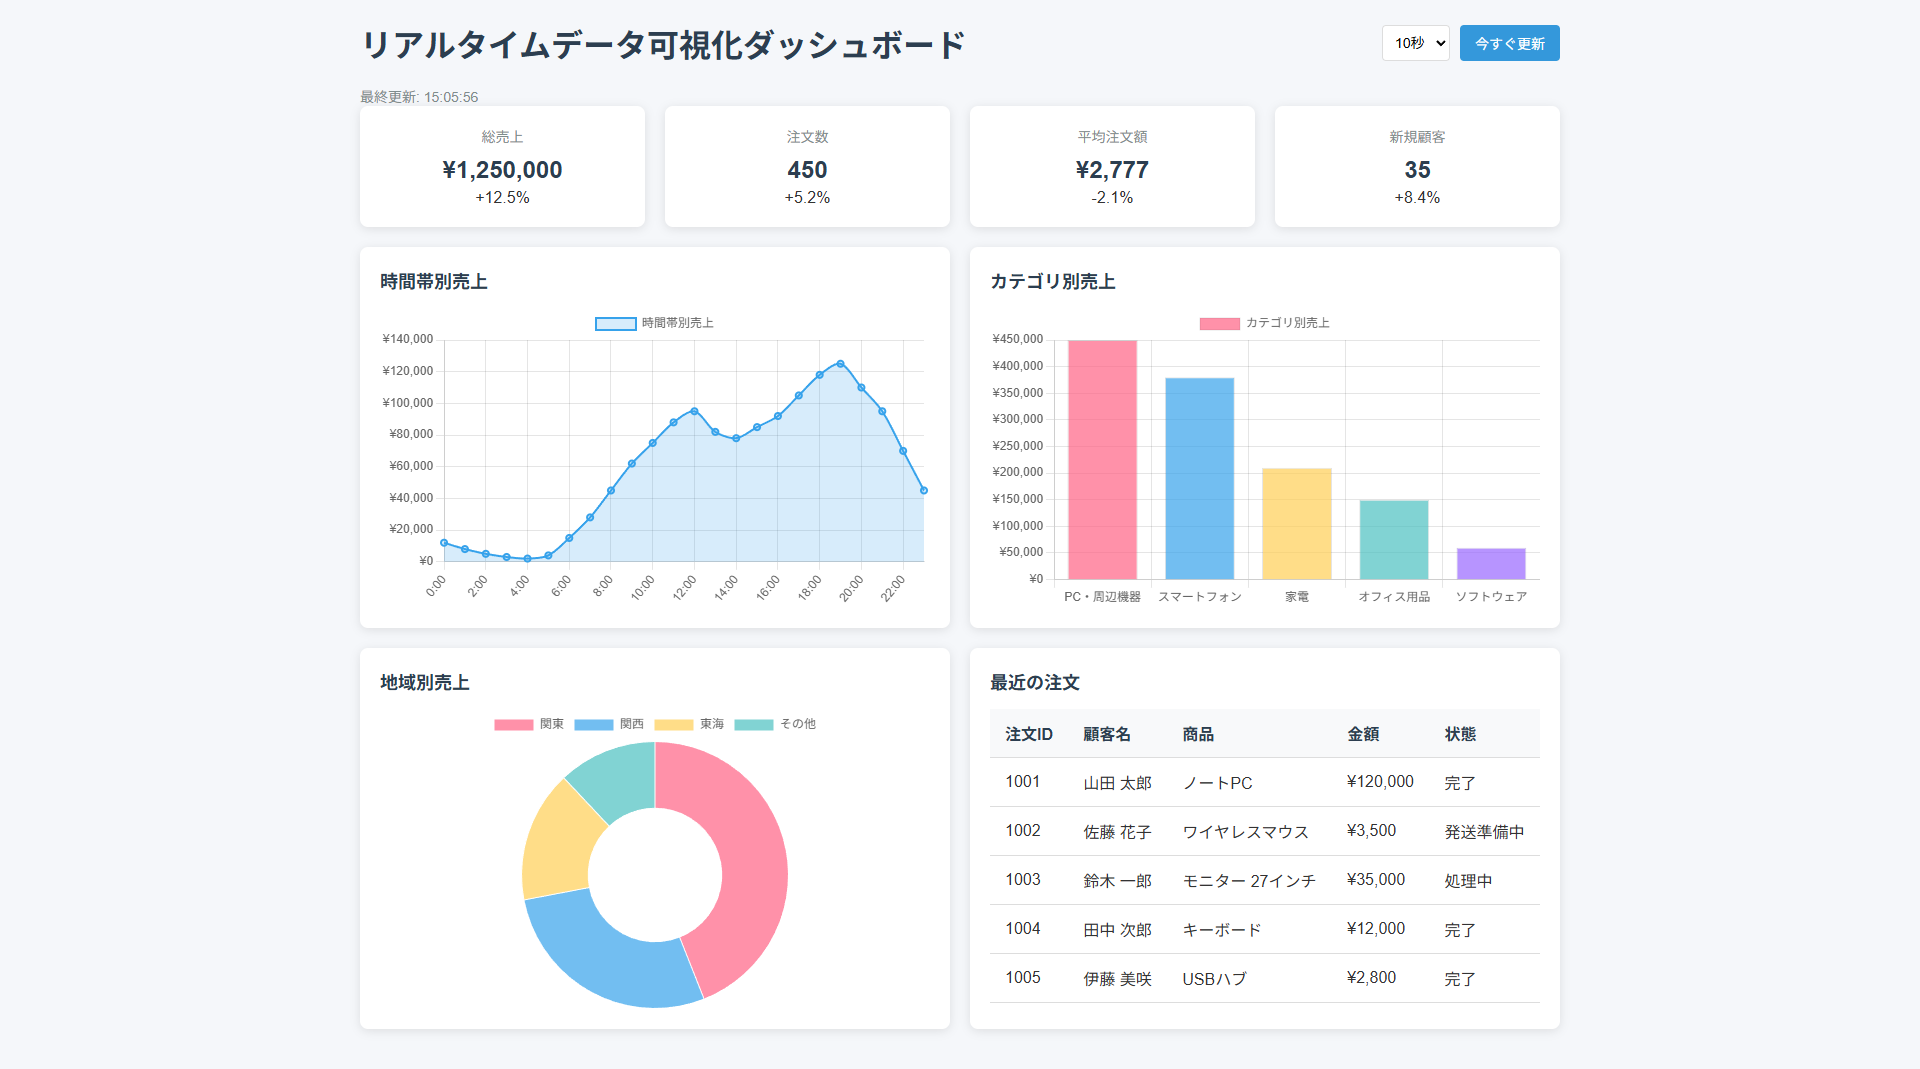
カスタムAPIを使ってリアルタイム売上ダッシュボードを作成するサンプルプログラムを紹介します。
本記事は「最小構成で動作検証 → 実DB連携」の2段階で解説します。
開発初期はカスタムAPI(モックデータ)でUIと動作をすばやく検証し、
その後に本番データへ差し替えることで開発スピードと品質の両立を図れます。
簡易実装パターン(モックデータ)
まずは実DBを使わずにモックデータを返すAPIで画面イメージと基本動作を確認します。
HTML描画用の閲覧フォームとPHP設置用のフォームの二枚のフォームを予め作成してください。
UI検討や初期実装では、この方法で素早く動作を確認することを推奨します。
HTML
以下のコードを閲覧用のフォームに配置してください。
<!DOCTYPE html>
<html id="SMP_STYLE">
<head>
<meta charset="UTF-8">
<meta name="viewport" content="width=device-width, initial-scale=1.0">
<script src="https://cdn.jsdelivr.net/npm/chart.js"></script>
<title>リアルタイムデータ可視化ダッシュボード</title>
<style type="text/css">
body {
font-family: 'Helvetica Neue', Arial, sans-serif;
margin: 0;
padding: 20px;
background-color: #f5f7fa;
color: #333;
}
.dashboard-container {
max-width: 1200px;
margin: 0 auto;
}
.dashboard-header {
display: flex;
justify-content: space-between;
align-items: center;
margin-bottom: 20px;
}
.dashboard-title {
margin: 0;
color: #2c3e50;
}
.dashboard-controls {
display: flex;
gap: 10px;
}
.dashboard-refresh {
background-color: #3498db;
color: white;
border: none;
padding: 8px 15px;
border-radius: 4px;
cursor: pointer;
font-size: 14px;
transition: background-color 0.3s;
}
.dashboard-refresh:hover {
background-color: #2980b9;
}
.dashboard-interval {
padding: 8px;
border: 1px solid #ddd;
border-radius: 4px;
font-size: 14px;
}
.dashboard-status {
font-size: 14px;
color: #7f8c8d;
}
.dashboard-grid {
display: grid;
grid-template-columns: repeat(auto-fit, minmax(500px, 1fr));
gap: 20px;
margin-bottom: 20px;
}
.dashboard-card {
background-color: white;
border-radius: 8px;
box-shadow: 0 2px 10px rgba(0, 0, 0, 0.1);
padding: 20px;
}
.dashboard-card-header {
display: flex;
justify-content: space-between;
align-items: center;
margin-bottom: 15px;
}
.dashboard-card-title {
margin: 0;
font-size: 18px;
color: #2c3e50;
}
.dashboard-card-value {
font-size: 24px;
font-weight: bold;
color: #3498db;
}
.dashboard-chart-container {
position: relative;
height: 300px;
}
.dashboard-table {
width: 100%;
border-collapse: collapse;
}
.dashboard-table th,
.dashboard-table td {
padding: 12px 15px;
text-align: left;
border-bottom: 1px solid #ddd;
}
.dashboard-table th {
background-color: #f8f9fa;
font-weight: bold;
color: #2c3e50;
}
.dashboard-table tr:hover {
background-color: #f5f7fa;
}
.dashboard-loading {
display: none;
position: fixed;
top: 0;
left: 0;
width: 100%;
height: 100%;
background-color: rgba(255, 255, 255, 0.7);
z-index: 1000;
justify-content: center;
align-items: center;
}
.dashboard-spinner {
border: 4px solid rgba(0, 0, 0, 0.1);
border-radius: 50%;
border-top: 4px solid #3498db;
width: 40px;
height: 40px;
animation: spin 1s linear infinite;
}
@keyframes spin {
0% { transform: rotate(0deg); }
100% { transform: rotate(360deg); }
}
.positive-trend {
color: #27ae60;
}
.negative-trend {
color: #e74c3c;
}
.trend-indicator {
margin-left: 5px;
}
.dashboard-summary {
display: grid;
grid-template-columns: repeat(auto-fit, minmax(200px, 1fr));
gap: 20px;
margin-bottom: 20px;
}
.summary-card {
background-color: white;
border-radius: 8px;
box-shadow: 0 2px 10px rgba(0, 0, 0, 0.1);
padding: 20px;
text-align: center;
}
.summary-title {
font-size: 14px;
color: #7f8c8d;
margin-bottom: 10px;
}
.summary-value {
font-size: 24px;
font-weight: bold;
color: #2c3e50;
margin-bottom: 5px;
}
.summary-change {
font-size: 14px;
}
</style>
</head>
<body class="body">
<div class="dashboard-container">
<div class="dashboard-header">
<h1 class="dashboard-title">リアルタイムデータ可視化ダッシュボード</h1>
<div class="dashboard-controls">
<select id="interval-select" class="dashboard-interval">
<option value="5000">5秒</option>
<option value="10000" selected>10秒</option>
<option value="30000">30秒</option>
<option value="60000">1分</option>
</select>
<button id="refresh-button" class="dashboard-refresh">今すぐ更新</button>
</div>
</div>
<div id="last-updated" class="dashboard-status">最終更新: -</div>
<div class="dashboard-summary">
<div class="summary-card">
<div class="summary-title">総売上</div>
<div id="total-sales" class="summary-value">\0</div>
<div id="sales-change" class="summary-change">前日比: <span class="positive-trend">+0%</span></div>
</div>
<div class="summary-card">
<div class="summary-title">注文数</div>
<div id="total-orders" class="summary-value">0</div>
<div id="orders-change" class="summary-change">前日比: <span class="positive-trend">+0%</span></div>
</div>
<div class="summary-card">
<div class="summary-title">平均注文額</div>
<div id="average-order" class="summary-value">\0</div>
<div id="average-change" class="summary-change">前日比: <span class="positive-trend">+0%</span></div>
</div>
<div class="summary-card">
<div class="summary-title">新規顧客</div>
<div id="new-customers" class="summary-value">0</div>
<div id="customers-change" class="summary-change">前日比: <span class="positive-trend">+0%</span></div>
</div>
</div>
<div class="dashboard-grid">
<div class="dashboard-card">
<div class="dashboard-card-header">
<h2 class="dashboard-card-title">時間帯別売上</h2>
</div>
<div class="dashboard-chart-container">
<canvas id="sales-chart"></canvas>
</div>
</div>
<div class="dashboard-card">
<div class="dashboard-card-header">
<h2 class="dashboard-card-title">カテゴリ別売上</h2>
</div>
<div class="dashboard-chart-container">
<canvas id="category-chart"></canvas>
</div>
</div>
<div class="dashboard-card">
<div class="dashboard-card-header">
<h2 class="dashboard-card-title">地域別売上</h2>
</div>
<div class="dashboard-chart-container">
<canvas id="region-chart"></canvas>
</div>
</div>
<div class="dashboard-card">
<div class="dashboard-card-header">
<h2 class="dashboard-card-title">最近の注文</h2>
</div>
<table class="dashboard-table">
<thead>
<tr>
<th>注文ID</th>
<th>顧客名</th>
<th>商品</th>
<th>金額</th>
<th>状態</th>
</tr>
</thead>
<tbody id="recent-orders">
<tr>
<td colspan="5">データを読み込み中...</td>
</tr>
</tbody>
</table>
</div>
</div>
</div>
<div id="loading" class="dashboard-loading">
<div class="dashboard-spinner"></div>
</div>
<script>
// ダッシュボード用のシンプルなJavaScript
document.addEventListener('DOMContentLoaded', function() {
    // カスタムAPIのエンドポイント(実際の環境に合わせて変更してください)
    const API_ENDPOINT = 'PHP設置用のフォームのURL';

    // 更新間隔(ミリ秒)
    let updateInterval = 30000; // デフォルト: 30秒
let updateTimer = null;
// Chart.jsのグラフインスタンス
let hourlyChart = null;
let categoryChart = null;
let regionChart = null;
// 初期化関数
function initialize() {
// 更新間隔の設定
document.getElementById('interval-select').addEventListener('change', function() {
updateInterval = parseInt(this.value);
restartUpdateTimer();
});
// 初回データ取得
fetchAllData();
// 定期更新の開始
startUpdateTimer();
}
// 更新タイマーの開始
function startUpdateTimer() {
updateTimer = setInterval(fetchAllData, updateInterval);
}
// 更新タイマーの再起動
function restartUpdateTimer() {
if (updateTimer) {
clearInterval(updateTimer);
}
startUpdateTimer();
}
// すべてのデータを取得
function fetchAllData() {
fetchSalesSummary();
fetchHourlySales();
fetchCategorySales();
fetchRegionSales();
fetchRecentOrders();
// 最終更新時刻の表示
const now = new Date();
document.getElementById('last-updated').textContent =
`最終更新: ${now.getHours()}:${String(now.getMinutes()).padStart(2, '0')}:${String(now.getSeconds()).padStart(2, '0')}`;
}
// APIリクエストを実行する関数
function callApi(action, params = {}) {
showLoading(`${action}-container`);
const postData = new URLSearchParams({
action: action,
...params
});
return fetch(API_ENDPOINT, {
method: 'POST',
headers: {
'Content-Type': 'application/x-www-form-urlencoded'
},
body: postData.toString()
})
.then(response => {
console.log('HTTPステータス:', response.status);
return response.text(); // base64文字列が返ってくる想定
})
.then(encoded => {
console.log('受信(base64):', encoded);
const trimmed = encoded.trim();
const jsonStr = decodeBase64Utf8(trimmed);
console.log('デコード後JSON文字列:', jsonStr);
const data = JSON.parse(jsonStr);
hideLoading(`${action}-container`);
return data;
})
.catch(error => {
console.error(`${action}データの取得中にエラーが発生しました:`, error);
hideLoading(`${action}-container`);
throw error;
});
}
// 売上サマリーデータの取得
function fetchSalesSummary() {
showLoading('summary-container');
callApi('getSalesSummary')
.then(data => {
updateSalesSummary(data.data.result);
hideLoading('summary-container');
})
.catch(() => {
// エラーハンドリングは既にcallApi内で行っているため、ここでは何もしない
});
}
// 時間帯別売上データの取得
function fetchHourlySales() {
showLoading('hourly-chart-container');
callApi('getHourlySales')
.then(data => {
updateHourlySalesChart(data.data.result.hourly);
hideLoading('hourly-chart-container');
})
.catch(() => {
// エラーハンドリングは既にcallApi内で行っているため、ここでは何もしない
});
}
// カテゴリ別売上データの取得
function fetchCategorySales() {
showLoading('category-chart-container');
callApi('getCategorySales')
.then(data => {
updateCategorySalesChart(data.data.result.categories);
hideLoading('category-chart-container');
})
.catch(() => {
// エラーハンドリングは既にcallApi内で行っているため、ここでは何もしない
});
}
// 地域別売上データの取得
function fetchRegionSales() {
showLoading('region-chart-container');
callApi('getRegionSales')
.then(data => {
updateRegionSalesChart(data.data.result.regions);
hideLoading('region-chart-container');
})
.catch(() => {
// エラーハンドリングは既にcallApi内で行っているため、ここでは何もしない
});
}
// 最近の注文データの取得
function fetchRecentOrders() {
showLoading('recent-orders-container');
callApi('getRecentOrders')
.then(data => {
updateRecentOrdersTable(data.data.result.orders);
hideLoading('recent-orders-container');
})
.catch(() => {
// エラーハンドリングは既にcallApi内で行っているため、ここでは何もしない
});
}
// 売上サマリーの更新
function updateSalesSummary(data) {
document.getElementById('total-sales').textContent = formatCurrency(data.totalSales);
document.getElementById('sales-change').textContent = formatPercentage(data.salesChangePercent);
document.getElementById('sales-change').className = getChangeClass(data.salesChangePercent);
document.getElementById('total-orders').textContent = data.totalOrders;
document.getElementById('orders-change').textContent = formatPercentage(data.ordersChangePercent);
document.getElementById('orders-change').className = getChangeClass(data.ordersChangePercent);
document.getElementById('average-order').textContent = formatCurrency(data.averageOrder);
document.getElementById('average-change').textContent = formatPercentage(data.averageChangePercent);
document.getElementById('average-change').className = getChangeClass(data.averageChangePercent);
document.getElementById('new-customers').textContent = data.newCustomers;
document.getElementById('customers-change').textContent = formatPercentage(data.customersChangePercent);
document.getElementById('customers-change').className = getChangeClass(data.customersChangePercent);
}
// 時間帯別売上チャートの更新
function updateHourlySalesChart(hourlyData) {
const labels = hourlyData.map(item => `${item.hour}:00`);
const salesData = hourlyData.map(item => item.sales);
const ctx = document.getElementById('sales-chart').getContext('2d');
if (hourlyChart) {
hourlyChart.data.labels = labels;
hourlyChart.data.datasets[0].data = salesData;
hourlyChart.update();
} else {
hourlyChart = new Chart(ctx, {
type: 'line',
data: {
labels: labels,
datasets: [{
label: '時間帯別売上',
data: salesData,
borderColor: 'rgba(54, 162, 235, 1)',
backgroundColor: 'rgba(54, 162, 235, 0.2)',
borderWidth: 2,
tension: 0.3,
fill: true
}]
},
options: {
responsive: true,
maintainAspectRatio: false,
scales: {
y: {
beginAtZero: true,
ticks: {
callback: function(value) {
return '\u00A5' + value.toLocaleString();
}
}
}
}
}
});
}
}
// カテゴリ別売上チャートの更新
function updateCategorySalesChart(categoryData) {
const labels = categoryData.map(item => item.name);
const salesData = categoryData.map(item => item.sales);
const ctx = document.getElementById('category-chart').getContext('2d');
if (categoryChart) {
categoryChart.data.labels = labels;
categoryChart.data.datasets[0].data = salesData;
categoryChart.update();
} else {
categoryChart = new Chart(ctx, {
type: 'bar',
data: {
labels: labels,
datasets: [{
label: 'カテゴリ別売上',
data: salesData,
backgroundColor: [
'rgba(255, 99, 132, 0.7)',
'rgba(54, 162, 235, 0.7)',
'rgba(255, 206, 86, 0.7)',
'rgba(75, 192, 192, 0.7)',
'rgba(153, 102, 255, 0.7)'
],
borderWidth: 1
}]
},
options: {
responsive: true,
maintainAspectRatio: false,
scales: {
y: {
beginAtZero: true,
ticks: {
callback: function(value) {
return '\u00A5' + value.toLocaleString();
}
}
}
}
}
});
}
}
// 地域別売上チャートの更新
function updateRegionSalesChart(regionData) {
const labels = regionData.map(item => item.name);
const salesData = regionData.map(item => item.sales);
const ctx = document.getElementById('region-chart').getContext('2d');
if (regionChart) {
regionChart.data.labels = labels;
regionChart.data.datasets[0].data = salesData;
regionChart.update();
} else {
regionChart = new Chart(ctx, {
type: 'doughnut',
data: {
labels: labels,
datasets: [{
label: '地域別売上',
data: salesData,
backgroundColor: [
'rgba(255, 99, 132, 0.7)',
'rgba(54, 162, 235, 0.7)',
'rgba(255, 206, 86, 0.7)',
'rgba(75, 192, 192, 0.7)'
],
borderWidth: 1
}]
},
options: {
responsive: true,
maintainAspectRatio: false
}
});
}
}
// 最近の注文テーブルの更新
function updateRecentOrdersTable(orders) {
const tableBody = document.getElementById('recent-orders');
tableBody.innerHTML = '';
orders.forEach(order => {
const row = document.createElement('tr');
const idCell = document.createElement('td');
idCell.textContent = order._id;
row.appendChild(idCell);
const customerCell = document.createElement('td');
customerCell.textContent = order.customer_name;
row.appendChild(customerCell);
const productCell = document.createElement('td');
productCell.textContent = order.product;
row.appendChild(productCell);
const amountCell = document.createElement('td');
amountCell.textContent = formatCurrency(order.total_amount);
row.appendChild(amountCell);
const statusCell = document.createElement('td');
statusCell.textContent = order.status;
row.appendChild(statusCell);
tableBody.appendChild(row);
});
}
// ローディング表示
function showLoading(containerId) {
const container = document.getElementById(containerId);
if (container) {
container.classList.add('loading');
}
}
// ローディング非表示
function hideLoading(containerId) {
const container = document.getElementById(containerId);
if (container) {
container.classList.remove('loading');
}
}
// 通貨フォーマット
function formatCurrency(value) {
const num = Number(value);
if (isNaN(num)) return '\u00A50';
return '\u00A5' + Math.floor(num).toLocaleString();
}
// パーセンテージフォーマット
function formatPercentage(value) {
return (value > 0 ? '+' : '') + value + '%';
}
// 変化率のクラス取得
function getChangeClass(value) {
return value > 0 ? 'positive-change' : (value < 0 ? 'negative-change' : 'no-change');
}
// 日時フォーマット
function formatDateTime(dateTimeStr) {
const date = new Date(dateTimeStr);
return `${date.getFullYear()}/${(date.getMonth() + 1).toString().padStart(2, '0')}/${date.getDate().toString().padStart(2, '0')} ${date.getHours().toString().padStart(2, '0')}:${date.getMinutes().toString().padStart(2, '0')}`;
}
// base64(UTF-8想定)→ 通常のJS文字列
function decodeBase64Utf8(base64Str) {
const binary = atob(base64Str); // バイナリ文字列
const len = binary.length;
const bytes = new Uint8Array(len);
for (let i = 0; i < len; i++) {
bytes[i] = binary.charCodeAt(i); // 0〜255の数値配列にする
}
return new TextDecoder('utf-8').decode(bytes); // UTF-8としてデコード
}
// 初期化実行
initialize();
});
</script>
</body>
</html>
【編集箇所】HTMLソース内>JavaScript変更箇所について
重要: API_ENDPOINTには、PHP設置用のフォームのURLを設定します。
// カスタムAPIのエンドポイント(実際の環境に合わせて変更してください)
const API_ENDPOINT = 'PHP設置用のフォームのURL';
// 更新間隔(ミリ秒)
let updateInterval = 30000; // デフォルト: 30秒
PHP設置用のフォーム(モックデータ PHP)
以下のPHPをPHP設置用のフォームに設定します。モックデータをJSONで返すだけの最小構成です。
<?//<!-- SMP_DYNAMIC_PAGE DISPLAY_ERRORS=ON NAME=XXX -->?>
<?php

if ($_SERVER['REQUEST_METHOD'] === 'POST') {

    $requestBody = $_POST;
    $action = $requestBody['action'] ?? '';

    $response = [
        'status' => 'success',
        'data' => [
            'success' => true,
            'result'  => null,
            'error'   => null,
        ],
    ];

    switch ($action) {
        // ■アクション: 売上サマリーの取得(画面上部の4つのカード用)
        case 'getSalesSummary':
            $response['data']['result'] = [
                // [左上のカード] 総売上金額
                // 表示ID: total-sales
                'totalSales'             => 1250000,

                // [左上のカード] 総売上の変化率
                // 表示ID: sales-change
                'salesChangePercent'     => 12.5,

                // [左から2番目のカード] 総注文数
                // 表示ID: total-orders
                'totalOrders'            => 450,

                // [左から2番目のカード] 総注文数の変化率
                // 表示ID: orders-change
                'ordersChangePercent'    => 5.2,

                // [左から3番目のカード] 平均注文額
                // 表示ID: average-order
                'averageOrder'           => 2777,

                // [左から3番目のカード] 平均注文額の変化率
                // 表示ID: average-change
                'averageChangePercent'   => -2.1,

                // [右上のカード] 新規顧客数
                // 表示ID: new-customers
                'newCustomers'           => 35,

                // [右上のカード] 新規顧客数の変化率
                // 表示ID: customers-change
                'customersChangePercent' => 8.4,
            ];
            break;

        // ■アクション: 時間帯別売上の取得(左側の折れ線グラフ用)
        case 'getHourlySales':
            $response['data']['result'] = [
                'hourly' => [
                    // hour: X軸(時間), sales: Y軸(売上金額)
                    // グラフID: sales-chart
                    ['hour' => 0,  'sales' => 12000],
                    ['hour' => 1,  'sales' => 8000],
                    ['hour' => 2,  'sales' => 5000],
                    ['hour' => 3,  'sales' => 3000],
                    ['hour' => 4,  'sales' => 2000],
                    ['hour' => 5,  'sales' => 4000],
                    ['hour' => 6,  'sales' => 15000],
                    ['hour' => 7,  'sales' => 28000],
                    ['hour' => 8,  'sales' => 45000],
                    ['hour' => 9,  'sales' => 62000],
                    ['hour' => 10, 'sales' => 75000],
                    ['hour' => 11, 'sales' => 88000],
                    ['hour' => 12, 'sales' => 95000],
                    ['hour' => 13, 'sales' => 82000],
                    ['hour' => 14, 'sales' => 78000],
                    ['hour' => 15, 'sales' => 85000],
                    ['hour' => 16, 'sales' => 92000],
                    ['hour' => 17, 'sales' => 105000],
                    ['hour' => 18, 'sales' => 118000],
                    ['hour' => 19, 'sales' => 125000],
                    ['hour' => 20, 'sales' => 110000],
                    ['hour' => 21, 'sales' => 95000],
                    ['hour' => 22, 'sales' => 70000],
                    ['hour' => 23, 'sales' => 45000],
                ],
            ];
            break;

        // ■アクション: カテゴリ別売上の取得(右上の棒グラフ用)
        case 'getCategorySales':
            $response['data']['result'] = [
                'categories' => [
                    // name: カテゴリ名(X軸), sales: 売上金額(Y軸)
                    // グラフID: category-chart
                    ['name' => 'PC・周辺機器',   'sales' => 450000],
                    ['name' => 'スマートフォン',   'sales' => 380000],
                    ['name' => '家電',   'sales' => 210000],
                    ['name' => 'オフィス用品',   'sales' => 150000],
                    ['name' => 'ソフトウェア', 'sales' => 60000],
                ],
            ];
            break;

        // ■アクション: 地域別売上の取得(左下のドーナツチャート用)
        case 'getRegionSales':
            $response['data']['result'] = [
                'regions' => [
                    // name: 地域名(凡例), sales: 売上金額(割合として表示)
                    // グラフID: region-chart
                    ['name' => '関東', 'sales' => 550000],
                    ['name' => '関西', 'sales' => 350000],
                    ['name' => '東海', 'sales' => 200000],
                    ['name' => 'その他', 'sales' => 150000],
                ],
            ];
            break;

        // ■アクション: 最近の注文の取得(画面右下のテーブル用)
        case 'getRecentOrders':
            $response['data']['result'] = [
                'orders' => [
                    // テーブルID: recent-orders
                    // _id: 注文ID, customer_name: 顧客名, product: 商品名, total_amount: 金額, status: ステータス
                    ['_id' => '1001', 'customer_name' => '山田 太郎', 'product' => 'ノートPC',   'total_amount' => 120000, 'status' => '完了'],
                    ['_id' => '1002', 'customer_name' => '佐藤 花子', 'product' => 'ワイヤレスマウス',   'total_amount' =>  3500, 'status' => '発送準備中'],
                    ['_id' => '1003', 'customer_name' => '鈴木 一郎', 'product' => 'モニター 27インチ',   'total_amount' =>  35000, 'status' => '処理中'],
                    ['_id' => '1004', 'customer_name' => '田中 次郎', 'product' => 'キーボード',       'total_amount' =>  12000, 'status' => '完了'],
                    ['_id' => '1005', 'customer_name' => '伊藤 美咲', 'product' => 'USBハブ','total_amount' =>  2800, 'status' => '完了'],
                ],
            ];
            break;

        default:
            $response['status']          = 'error';
            $response['data']['success'] = false;
            $response['data']['error']   = 'Invalid action: ' . $action;
            break;
    }

    // 1. PHP 配列 → JSON文字列
    $json = json_encode($response, JSON_UNESCAPED_UNICODE | JSON_UNESCAPED_SLASHES);

    if ($json === false) {
        $errorJson = json_encode([
            'status' => 'error',
            'data'   => [
                'success' => false,
                'result'  => null,
                'error'   => 'json_encode failed: ' . json_last_error_msg(),
            ],
        ], JSON_UNESCAPED_UNICODE | JSON_UNESCAPED_SLASHES);

        echo base64_encode($errorJson);
        exit;
    }

    // 2. JSON文字列 → base64文字列
    echo base64_encode($json);
    exit;
}
?>
実装のポイント
setIntervalでデータを一定間隔で取得し再描画2. 可視化: Chart.jsを使い折れ線・棒・円グラフを表示
3. 更新間隔変更: ユーザーが更新間隔を動的に指定可能
4. レスポンシブ: グリッドレイアウトで各画面サイズに対応
5. UX向上: ローディング表示・最終更新時刻の明示
本格実装パターン(DB連携)
PHP設置用のフォーム(モックデータ PHP)でUIを確認できたら、実際のDBデータを取得するPHPへ切り替えます。
本格実装パターンを用いる場合は、モックデータを返しているPHPの形式に合わせて、
環境内のDBをdoselect等で取得して返すように設定してください。
発展的な機能拡張
以下の機能を追加することで、さらに実用的なダッシュボードへ発展させられます。
2. ダッシュボードレイアウト変更: ユーザー自身が表示項目をカスタマイズ
3. アラート: 売上急変時に通知を表示
4. エクスポート: CSV/PDFなどへのデータ書き出し
5. 予測分析: 過去データを用いた売上予測の表示